This Power BI project visualizes company sales performance against targets to support strategic monitoring and decision-making.
It incorporates key metrics such as Current Achieved, Last Achieved, Current Backlog, Booking, Quota, Achieved %, Cumulative Achieved %, Growth %, Cumulative YOY %, and B/B Ratio
—each chosen to capture sales progress, year-over-year growth, demand versus fulfillment, and overall target attainment.
Achievement and growth metrics help evaluate short- and long-term performance,
while operational ratios like the B/B Ratio reveal the balance between incoming orders and fulfilled sales, signaling future pipeline strength.
On the other hand, filters for Year, Salesperson, Customer, Region, and Country allow users to analyze performance across different time periods, individual contributions, key accounts, and market regions—supporting more targeted sales and resource strategies.
🗝 Keywords: Data Analysis, Data Visualization, Power BI
📊 Dashboard Showcase
The report includes three pages:
• Sales Target Overview: Trend charts and gauges display achievement rates, growth trends, and order ratios, with a detailed KPI table. • Sales Breakdown: Sunburst chart and matrix visualize proportional contributions by region, customer, and salesperson. • Cumulative Sales Achievement: Dual bar charts compare quotas to actual performance with color-coded table highlighting underperformance.
• Single-directional
• Star Schema
• Customer, Product, and Sales connected via keys
5. Create DAX Measures
• Total Sales, Year-over-Year (YOY)...
B. Case Study
1. Fact Tables
• Order Details (受訂明細): Order-level Transactional Data; Linked to 年度目標, 預計出貨, and 員工/客戶 Bridge. • Sales Details (銷售明細): Shipment data; Used to calculate "Current Year Sales" and "Last Year Sales". • Planned Shipment (預計出貨): Planned shipment info; Connects to Calendar and other dimensions.
2. Dimension Tables
• Employee (員工): Master data with unique IDs; Connected via Employee/Customer Bridge. • Customer (客戶): Master data including region; Connected via Employee/Customer Bridge. • Product (料號): Master data including specifications. • Calendar: Standard date table for time intelligence. • Year (年份): Supports filtering in DAX measures.
3. Bridge Table
• Employee/Customer Bridge (員工/客戶 Bridge): Handles many-to-many relationships between employees and customers.
4. Supporting Table
• Annual Target (年度目標): Yearly targets per customer, region, and employee; links to Calendar for analysis.
📊 DAX Techniques Deep Dive
A. Time Intelligence
1. 'Calendar' Table → the Real Date Dimension Linked to Facts
To enable consistent time intelligence across all metrics, I created a Date Dimension using DAX:
- Linked to multiple fact tables: FactSales, FactQuota, FactBooking, FactBacklog, FactTarget.
- Used for multi-select slicers.
- Benefits of a single Date Dimension:
• Ensures consistent date filtering across all measures.• Simplifies DAX calculations for time intelligence.
2. '年份' table → used only for filtering year (single-select)
I created a disconnected single-select table ('年份') as a Year Selector to improve user experience.
Measures use TREATAS to apply the selected year as a filter to the fact table, ensuring:
• Correct context transition
• Support for future multi-year selection without rewriting measures
This measure calculates sales for the year selected in the '年份' slicer.
-- Allows user to select a single year without affecting other slicers
-- TREATAS pushes the selected value as a filter to the fact table
-- Supports future multi-year selection without rewriting measures

Selected Year Sales =
VAR _Year = SELECTEDVALUE('年份'[年份])
RETURN
CALCULATE(
    SUMX(
        '銷售明細',
        [銷售金額]
    ),
    TREATAS({_Year}, '銷售明細'[出貨年])
)
4. Selected Last Year Sales Amount
This measure calculates sales for the year prior to the one selected in the '年份' slicer.
Useful for year-over-year comparisons and growth analysis.
Selected Last Year Sales =
VAR _Year = SELECTEDVALUE('年份'[年份])
RETURN
CALCULATE(
    SUMX(
        '銷售明細',
        [銷售金額]
    ),
    TREATAS({_Year}-1, '銷售明細'[出貨年])
)
5. B/B Ratio (Booking ÷ Sales)
Calculates ratio of current bookings to current sales.
Handles edge cases: blank/zero values return BLANK to avoid misleading results.
Selected Year Booking =
VAR _Year = SELECTEDVALUE('年份'[年份])
RETURN
CALCULATE(
    SUMX(
        '受訂明細',
        [金額]
    ),
    TREATAS({_Year}, '受訂明細'[年])
)
B/B Ratio =
VAR BB = DIVIDE('受訂明細'[Selected Year Booking], '銷售明細'[Selected Year Sales])
RETURN
IF(
    ISBLANK('受訂明細'[Selected Year Booking]) || '受訂明細'[Selected Year Booking] = 0
    || ISBLANK('銷售明細'[Selected Year Sales]) || '銷售明細'[Selected Year Sales] = 0,
    BLANK(),
    BB
)
6. Cumulative B/B Ratio
Calculates cumulative bookings ÷ cumulative sales from January to the selected month. Highlights:
• Uses DATESBETWEEN and EOMONTH to calculate Jan → Selected Month range
• Skips future months in the current year to maintain accuracy
• MY GOAL: Salesperson / Region / Country / Customer as a percentage of the total company revenue for that selected Year.
• DESIGN: ⚬ Users can apply slicers for Salesperson, Region/Country, and Customer. ⚬ Because the relationship between Salespersons and Customers is managed through a Bridge table, selecting a Salesperson should correctly restrict the list of visible Regions/Countries/Customers to only those handled by that salesperson. ⚬ A denominator where Salesperson selection is removed intentionally, but other necessary filters (e.g., Year) are kept. • Matrix Structure: ⚬ Rows: Salesperson / Region / Country / Customer ⚬ Columns: Year ⚬ Values: Sales Amount & Percentage of Total Company Revenue
• Explanation of ALL, ALLSELECTED, ALLEXCEPT: 1️⃣ ALLEXCEPT — “Keep only what I specify” ⚬ Example: ALLEXCEPT('銷售明細', '銷售明細'[Year]) → Year is preserved → All other filters in '銷售明細' table (Salesperson, Area, Country, Customer) are removed 2️⃣ ALL — “Clear everything” ⚬ Removes all filters from the specified table or column. ⚬ When used on '員工/客戶 Bridge'[業務員], it completely removes salesperson filtering (from slicers and model relationships). ⚬ Use when the denominator must ignore selections entirely. 3️⃣ ALLSELECTED — “Respect user slicers, ignore only the visual’s row/column context” ⚬ Removes filters except those created by the user’s selections in visuals.⚬ Useful for % of selected group comparisons.
• DAX Code Example 1️⃣ USING ALL()
-- ALL() example
銷售金額% =
VAR Amount =
    SUM('銷售明細'[金額])

RETURN
DIVIDE(
    Amount,
    CALCULATE(
        SUM('銷售明細'[金額]),
        ALLEXCEPT('銷售明細', '銷售明細'[Year]),  -- 保留欄位 Year
        ALL('員工/客戶 Bridge'[業務員])            -- 清除 Salesperson 篩選
    )
)
2️⃣ USING ALLSELECTED()
-- ALLSELECTED() example
銷售金額% =
VAR Amount =
    SUM('銷售明細'[金額])

RETURN
DIVIDE(
    Amount,
    CALCULATE(
        SUM('銷售明細'[金額]),
        ALLEXCEPT('銷售明細', '銷售明細'[Year]),  -- 保留欄位 Year
        ALLSELECTED('員工/客戶 Bridge'[業務員])
    )
)
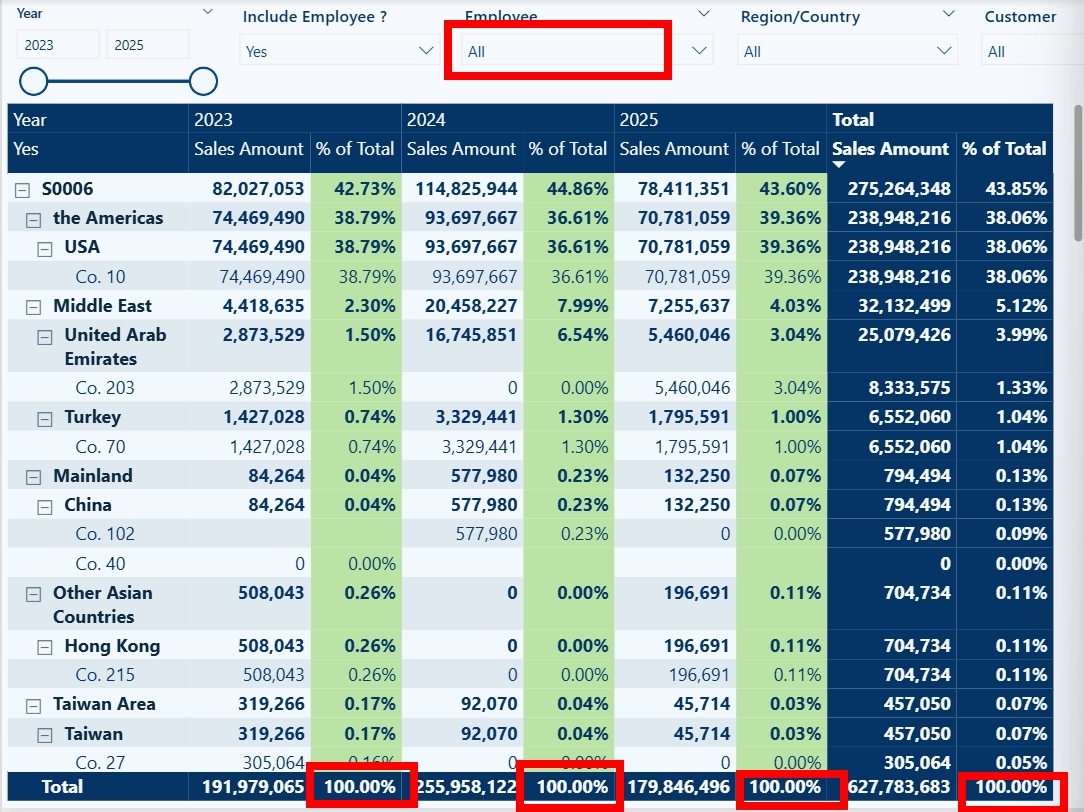
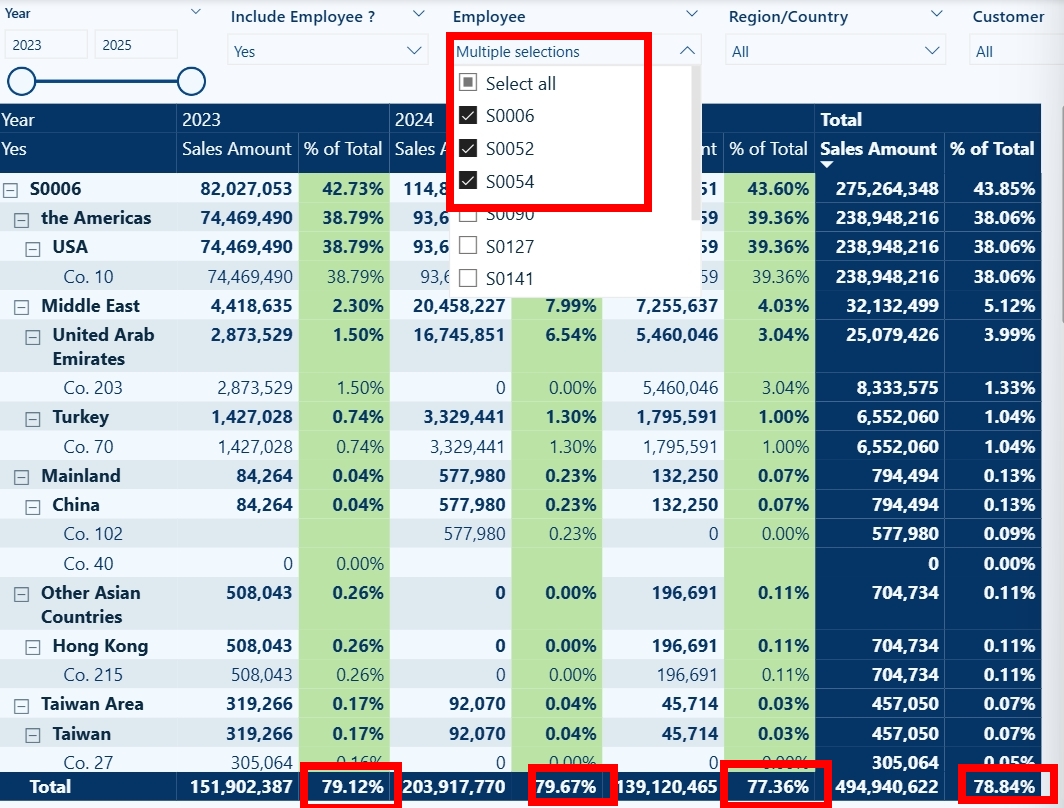
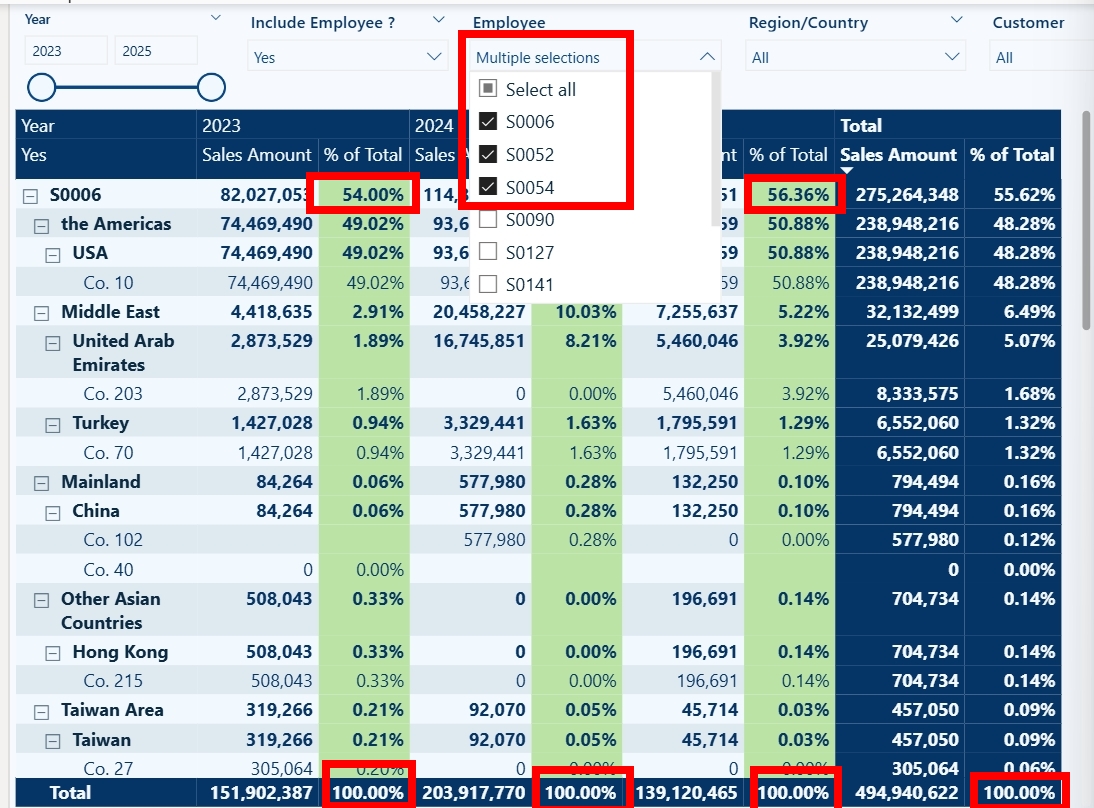
• Explanation of Image Differences
Image 2 — Sales Percentage of Total with ALL() applied Image 3 — Sales Percentage of Total with ALLSELECTED() applied
👉 Image 1 — No slicer selected ⚬ When the user hasn’t selected anything, ALL() and ALLSELECTED() behave the same.⚬ The total rows show 100% because both functions clear the Employee filter and calculate the percentage using the full dataset. 👉 Image 2 — Salesperson selected + ALL() ⚬ With ALL(), Power BI ignores the slicer completely.⚬ Even though the user selected only some employees, ALL() removes the Employee filter during the denominator calculation. ⚬ Result: → The numerator is filtered by selected employees. → The denominator is still the full sales amount for the whole year. → The total percentage becomes < 100%. 👉 Image 3 — Salesperson selected + ALLSELECTED() ⚬ The denominator now respects the user’s selection.⚬ Denominator = sales of the selected salesperson only.⚬ Result: Percentage = 100%, because the calculation compares the salesperson against themselves. • Summary